Tenzo dashboards: some of our favourites
In this article

Want to add these dashboards to your business?
See how Tenzo can supercharge your restaurant's performance!
Request a DemoThere are two types of people when it comes to building restaurant dashboards on Tenzo: the ‘I-know-what-I-want’ team and the ‘what-do-others-do’ team.
If you fall in the first camp, you know what insights and data you want to be looking at, you likely have a very complex Excel setup and you just want to replicate it in Tenzo so you can have reliable, real-time data to dive into.
The ‘what-do-others-do’ team want to know what we’ve found to be best practices or what we might recommend to them based on what we’ve seen work for others. They might have an idea of what they want, but they want to see some inspiration or get a starting point to play off of.
For people who fall into that camp, these are the dashboards we often recommend.
We know they work well. They can be adapted to individual business cases. And there’s a clear use case for each of them.
For current Tenzo customers, these dashboards are all available in your ‘Explore’ section as long as you have the required integration. Check out all these pre-set dashboards below!
Control labour costs
This one is all about controlling labour costs.
Taking action to adapt labour schedules within the week is one of the key actions that General Managers can take to control their location’s costs.
Tenzo’s ‘Control Labour Costs’ dashboard is designed to help General Managers and Operations teams understand their estimated end-of-week performance based on their current labour run rate in order to take action today.
Designed to be used on a daily basis to zoom in on the current week’s performance and understand what is driving labour costs and identify whether schedules need to be changed for future days.
How is your run rate looking for the week? Are you on track to meet your planned COL% or do you need to make adjustments?
Scorecard
Want a quick overview of what business operations looked like today?
The Scorecard Dashboard gives GMs a simple view of how they’ve performed today.
Whether it’s Sales, ATV, wet vs dry, labour or prime cost – this dashboard allows users to check in and see how they’re performing at a glance.
Forecast my revenue
The ‘Forecast my Revenue’ dashboard is designed to support Ops leaders create a structured repeatable process with their teams to forecast future sales.
It’s a dual-purpose dashboard. Use it on a daily basis to zoom in and track actual sales versus forecasted sales and understand forecast accuracy. Then weekly to oversee the forecasting process.
Are there specific locations with larger differences between sales forecast and actual sales? Do you understand why they are smashing it or having challenges this week? Does your planned labour cost as a % sales meet your business target? Have labour schedules been flexed to meet sales forecasts?
This dashboard will help you understand where changes can be made.
Reservations
Did you know we integrated with OpenTable and SevenRooms to bring reservations data in Tenzo?
Understand booking trends and compare sites to see how bookings affect performance.
If you’d like to find out more about how reservations slot into the wider Tenzo universe, get in touch!
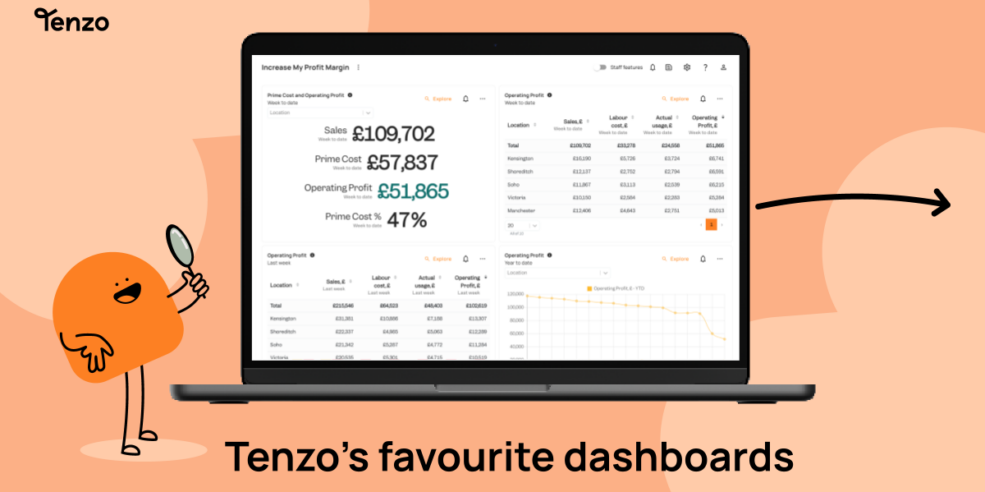
Increase my profit margin
Understanding the components that make up a location’s profit margin is crucial for success: Tenzo’s ‘Increase my Profit Margin’ dashboard is designed to support General Managers in understanding the components of their profit margin and identify whether it’s costs or sales they need to focus on to improve the performance of their location.
This dashboard is designed to be used on a weekly or monthly basis to be aligned with how your restaurant monitors overall performance.
Control Food costs
Next to labour, COGS are your biggest operational costs in a restaurant business so keeping a close eye on them is essential.
Tenzo’s ‘Control Food Costs’ dashboard is designed to help break down food costs to understand where you can make changes to reduce waste and improve inventory control.
Do you know how your purchases are split by vendor? Tracking changes weekly can alert you to whether you need to re-negotiate or change vendors for product items.
Looking at wastage across time can be a good way to set a target with your team to reduce this. Does your menu lend itself to using a ‘surplus unsold food’ third party app to sell some items that are otherwise ending in the bin?
Optimise labour planning
The ‘Optimise Labour Planning’ dashboard helps you build labour schedules that are responsive to future sales.
Designed to be used on a weekly basis to zoom out and review the performance of the past week’s schedules before diving in to design the next week’s schedule.
Questions to ask:
Were your labour costs in line with your sales, or were there days your labour costs ran higher than they should have?
Did you use the number of labour hours that you expected for the week despite daily changes?
How are your labour cost %s trending on average over the last 4 weeks?
Give your teams the tools they need to make the most informed, data-backed decisions in the moment!
Grow Revenue
Understand the levers you can pull to improve sales in your location, zoom in on key sales metrics and review performance across multiple dimensions.
Are you ahead or behind your sales budget? Are there more or less transactions going through the till than on average in the last four weeks? Are you seeing the same menu performance?
What’s the reason behind these changes? Can you make changes that improve the state of sales over the week?
If you’re not currently using Tenzo and think these dashboards could help in your business, get in touch today!
You may also like